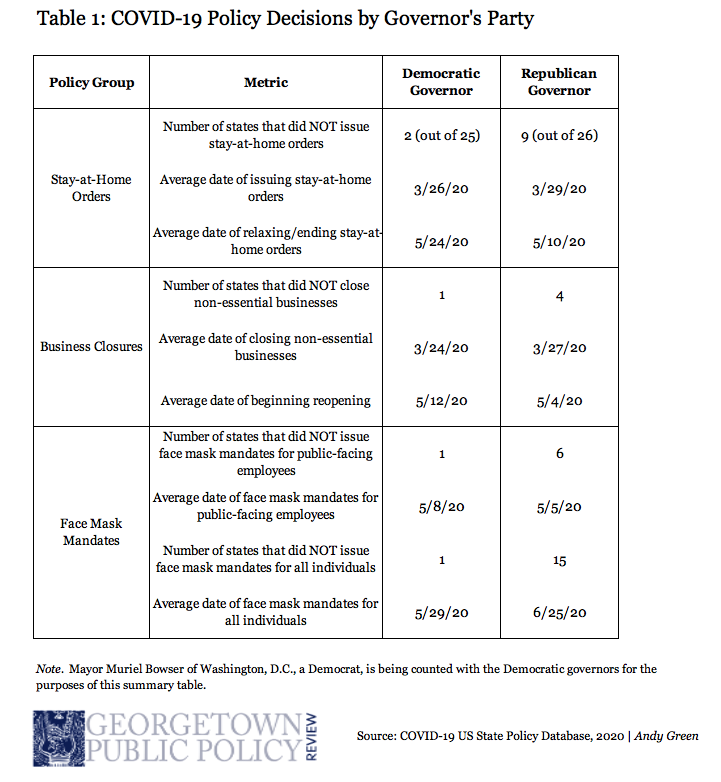
Visualizing COVID-19 Policy Responses and Outcomes by State and Party
The following is a series of interactive dashboards exploring how each state has responded to the COVID-19 pandemic, and how that may be related to the volume of cases and deaths experienced by that state. In addition to the state-level data, I also aggregate the data by the political party of a state's governor, reflecting the average of all states with Democratic and Republican governors, respectively.
These dashboards, along with a short accompanying piece, were published by the Georgetown Public Policy Review in August 2020. The link to that publication can be found here.
The data and code used in this analysis can be found here.